Efficient Analysis and Visualization of ChIP-seq Data via Genomic Databases
The ‘ngs.plot’ tool is a specialized resource designed to enhance the visualization and analysis of next-generation sequencing (NGS) data. This tool is particularly adept at quickly accessing and integrating large genomic databases to plot dense NGS data against a backdrop of functional genomic elements. One of the primary advantages of ‘ngs.plot’ is its ability to manage and visualize complex datasets with ease and precision. Users can rapidly generate high-quality plots of genomic regions of interest, which is critical for interpreting interactions and expression levels in various genomic studies, such as ChIP-seq and RNA-seq analyses. This protocol was created based on ngs.plot version 2.61 running on a system equipped with an Intel 10th generation i9-10910 processor and 48GB of memory. The test environment includes Python version 3.8.5, Perl version 5.26.2, and R version 4.4.0 under macOS 12.4 environment.
Step-by-Step Installation
1. Download ngs.plot package from GDrive (Official) to a desired folder and exract it as follow.
$ cd downloads
$ tar xvfz ngsplot-2.61.tar.gz
$ mv ngsplot-2.61 /Users/jchoi/ngsplot
2. Add ngsplot executables to your path under zshrc.
$ nano ~/.zshrc

# Add syntax as follows;
export PATH="/your/path/to/ngsplot/bin:$PATH"
export NGSPLOT="/your/path/to/ngsplot"

# For example
export PATH="/Users/Desktop/ChIP_seq/ngsplot/bin:$PATH"
export NGSPLOT="/Users/Desktop/ChIP_seq/ngsplot"
3. save and reload shell environment as follow.
$ source ~/.zshrc
4. Install ngs.plot dependent libraries in R.
install.packages("doMC", dep=T)
install.packages("caTools", dep=T)
install.packages("utils", dep=T)
BiocManager::install("BSgenome")
BiocManager::install("Rsamtools")
BiocManager::install("ShortRead")
5. Prepare Genome Database.
- Download desired genome database from GDrive (Official).
- Install this file as follows:
$ ngsplotdb.py list # check current list
ID       Assembly     Species      EnsVer   NPVer    InstalledFeatures
hg19	GRCh37	homo_sapiens	75.0	3.0	cgi,exon,genebody,tss,tes
IRGSP-1	IRGSP-1.0	oryza_sativa	21.0	3.0	exon,genebody,tss,tes

$ ngsplotdb.py install /Users/jchoi/Downloads/ngsplotdb_mm10_75_3.00.tar.gz # install databse

$ ngsplotdb.py list # check the installed database
ID       Assembly     Species      EnsVer   NPVer    InstalledFeatures
hg19	GRCh37	homo_sapiens	75.0	3.0	cgi,exon,genebody,tss,tes
IRGSP-1	IRGSP-1.0	oryza_sativa	21.0	3.0	exon,genebody,tss,tes
mm10	GRCm38	mus_musculus	75.0	3.0	cgi,exon,genebody,tss,tes
This tool may occasionally experience malfunctions. These are predominantly attributed to issues with Python syntax, and the author swiftly addresses and resolves these concerns by issuing updated source code. Should the tool cease to function abruptly, it is advisable to consult the creator’s GitHub repository.
Running ngs.plot
Use the following command to visulize enriched peaks from ChIP-seq data with
ngs.plot:$ ngs.plot.r -G <genome> -R <region> -C <IndexedInput.bam> -O <outputFolder> <OptionalParameters>In these commands,
Parameter Description -G <Genome>Specifies the genome name. Use ngsplotdb.pylist to show available genomes. See the Step-by-step Installation section.-R <region>Specifies genomic regions to plot. Possible values for region are tss,tes,genebody,exon,cgi, andenhancer.-C <IndexedInput.bam>Specifies the input file. This file reqires an indexed BAM file for single plot or a specific configuration file for multiplot (See the below). -O <outputFolder>Specifies the output file. Several files will be generated. Prepare a configuration file and save as plaintext (
name.txt) as follow:# If you want to specify the gene list as "genome", use "-1". # Use TAB to separate the three columns: coverage file<TAB>gene list<TAB>title # "title" will be shown in the figure's legend. hesc.H3k4me3.rmdup.sort.bam high_expressed_genes.txt "High" hesc.H3k4me3.rmdup.sort.bam medium_expressed_genes.txt "Med" hesc.H3k4me3.rmdup.sort.bam low_expressed_genes.txt "Low"Major Optional Parameters (
<OptionalParameter>)Parameter Description -T <Title>Specifies image title (Default: NoName). -L <int>Specifies size in bps. By default, when -R tss, tes, genebody,-L 2000; when-R exon, cgi,-L 500.-P <int>Specifies 0to use all CPUs that are detected on your machine.-FL <int>This parameter calculates physical instead of read coverage. This will produce figures that contain more accurate representation of ChIP enrichment.
You should set this value equal to the average fragment length in your sequencing library (Default: 150).-LEG <int>Control the display of legend: 1 (default) or 0 (No legend). -VLN <int>Control the display of vertical lines: 1 (default) or 0 (No line). For more detailed parameter options, see the ProgramArguments101.
Example Code
Here is an example command to depict peaks distribution:
  # Single plot
  $ ngs.plot.R -G mm10 -R genebody -C /Users/jchoi/Desktop/R_FINAL.bam -O /Users/jchoi/Desktop/NFIB \
  -T NFIB -L 2000 -SE 0 -FL 100 -LEG 0 -VLN 0

  # Multiplot
  ## Configuration file, H3K4_K27.txt
  Final.sort.H2O2_H3K27me3.bam:Final.sort.Unt_IPT.bam	-1	"H3K27me3"
  Final.sort.H2O2_H3K4me3.bam:Final.sort.Unt_IPT.bam	-1	"H3K4me3"
  ## Command
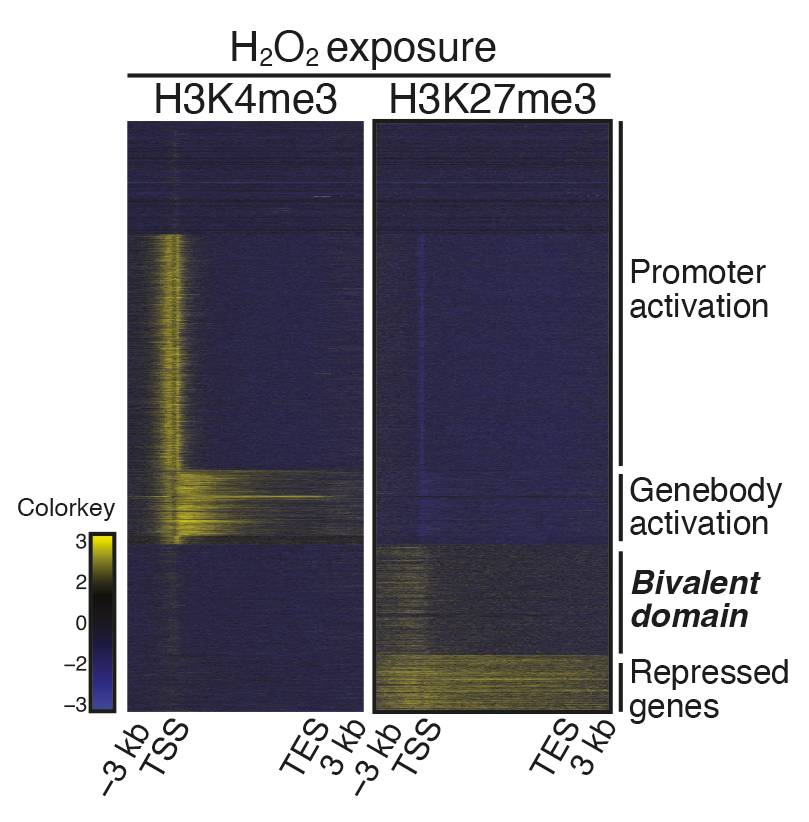
  $ ngs.plot.r -G hg19 -R genebody -C H3K4_K27.txt -O /Users/jchoi/Desktop/Bivalency \
  -L 3000 -SE 0 -FL 100 -LEG 0 -VLN 0 -YAS -0.4,1.5 -SC -2,4
Example Plot
The graph created using the second (multiplot) of the example codes above, refined using Illustrator 2024.

Citation
- Shen, L., Shao, N., Liu, X., & Nestler, E. (2014). ngs. plot: Quick mining and visualization of next-generation sequencing data by integrating genomic databases. BMC genomics, 15, 1-14. DOI


